|
9/27/2017 0 Comments Skateboarding Problem
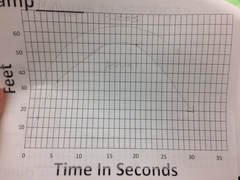
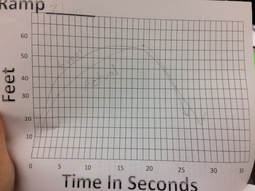
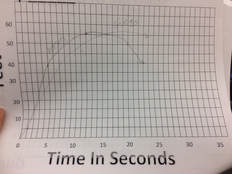
My predictions were fairly close to the actual graph, however there were obviously some discrepancies, as you can see. As to what reasoning lead me to my graph predictions, all I can say was I looked at the angle and made my best guess.
The zeros of the graph represent the point then the skateboard is no longer moving in the air. In all three graphs, the zeros are all obviously in the same place at the start (0,0), and when they finish, they are very close to the same spot as each other, too. The maximums and minimums vary, because the ramps are different heights, and thus the skateboard will have a different trajectory. The graphs rise the fastest when the skateboard is approaching the top height of its jump, as this is when its height is increasing the quickest. It is falling the fastest as it finishes its height climax, as this is when its height is decreasing the quickest. '
0 Comments
Leave a Reply. |
 RSS Feed
